

Sponsor Prospectus · Prepared for

IQGeo

One City. One Problem.

The Connected City

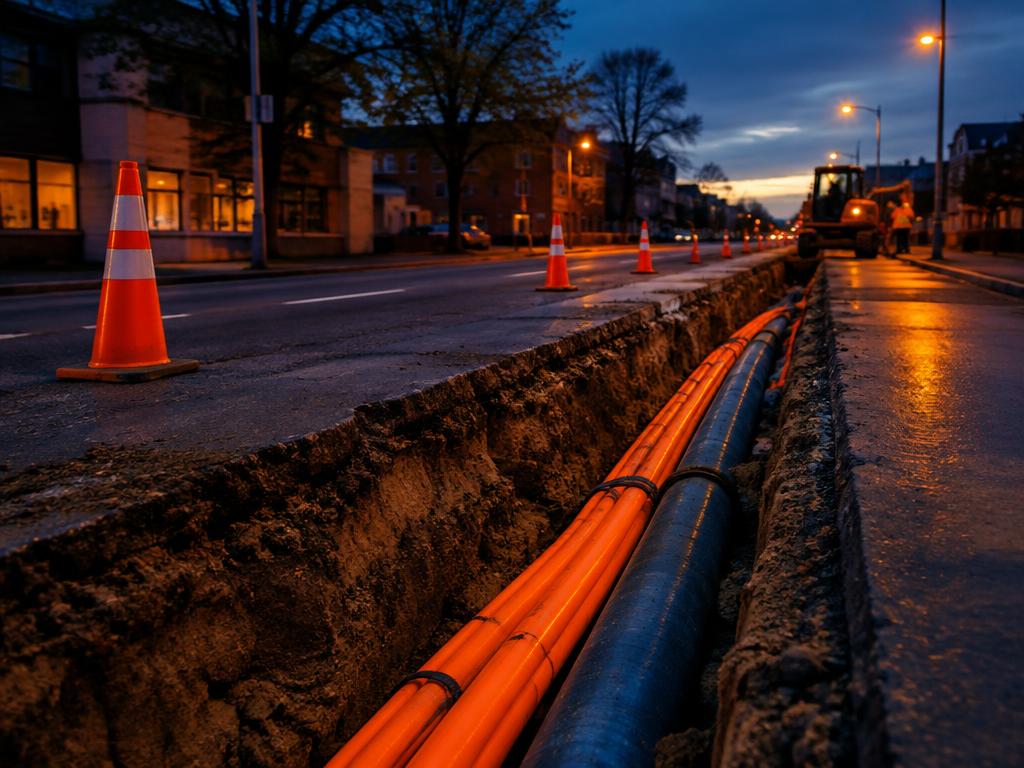
Every network runs through someone's street. Most cities can't see what's there.

A six-event, problem-led webinar series for U.S. local government. Each session takes one recognizable city problem — from a flood of small-cell permits to a 911 call that routes to the wrong address — and works it through with independent experts. IQGeo brings the expertise at the moment location data decides the outcome. No customer has to present for any event to happen.

What the city has on file vs. what's actually in the right-of-way
120,000+
local-government contacts
6
live problem-solving sessions
6
Post-Event Intelligence Reports
1
year-end State of Connectivity Intelligence report
Small cells ◆ Shot clocks ◆ Fiber permits ◆ Dig Once ◆ Conduit inventory ◆ Broadband gaps ◆ Coverage maps ◆ NG911 ◆ Address points ◆ Pole attachments ◆ Right-of-way fees ◆ Capital priorities ◆ Records that don't match reality ◆ Small cells ◆ Shot clocks ◆ Fiber permits ◆ Dig Once ◆ Conduit inventory ◆ Broadband gaps ◆ Coverage maps ◆ NG911 ◆ Address points ◆ Pole attachments ◆ Right-of-way fees ◆ Capital priorities ◆ Records that don't match reality ◆

Presented by IQGeo · Organized by ConnectMii Events · Hosted on AssetMapping.Events · Live 11:00 AM–12:30 PM Mountain

02The Problem

Private networks are built on public land. Cities are deciding about them half-blind.

Carriers and fiber providers plan with sophisticated location data — coverage models, demand forecasts, capital scenarios. The cities that permit, host and depend on those networks usually don't. Conduit sits unmapped. Pole and streetlight records live in spreadsheets. Coverage claims are hard to verify. Address data feeding 911 drifts out of date. The result: permits approved on guesswork, broadband dollars aimed at the wrong blocks, and right-of-way assets the city owns but can't price, lease or protect.

The network operators see the city in detail. The city rarely sees the network.

What operators typically know

  • Coverage and capacity by block
  • Demand by neighborhood
  • Candidate sites ranked
  • Cost per route

What cities typically know

  • Permit applications in a queue
  • Partial conduit records
  • Pole and light inventories of uneven quality
  • Resident complaints about dead zones

Illustrative.

IQGeo

Why IQGeo

IQGeo works where location data meets network decisions — integrating, analyzing and visualizing geospatial data so infrastructure can be planned, permitted and managed with evidence instead of assumption. The series topic is the decision IQGeo already informs.

Network models and compiled records are planning inputs, not field verification. The series says so plainly — and that candor is what earns the audience's trust.

03The Format

90 Minutes. One Problem. One Decision.

Not three presentations stitched together. A moderated problem-solving session.

  1. 01 · 10 min

    The Problem

    The moderator sets up the city, the network pressure, the budget and what data exists. “What would you do?”

  2. 02 · 15 min

    The First Response

    Each expert answers one clearly defined question.

  3. 03 · 10 min

    The Complication

    New information lands mid-session.

  4. 04 · 25 min

    Build the Solution

    Data, sequence, policy, cost, risk. IQGeo's expertise is most relevant here.

  5. 05 · 15 min

    The Audience Decides

    Live polls, including the Signature Poll.

  6. 06 · 15 min

    The Path Forward

    “If this were our city,” with three practical next actions.

Sample complications

The conduit map is from 1998.Three carriers filed the same week.The shot clock runs out Friday.The coverage map says the block is served. It isn't.The GIS analyst who built the address layer just left.

Traditional webinar

Customer → Project → Product → Results

Dependent on one customer being willing to participate.

One City. One Problem.

Problem → Experts → Complication → Decision → Technology in context → Path forward

Dependent only on a problem worth solving.

Customer stories don't disappear — they become optional: 15-minute moderated interview · Recorded cameo · One project lesson · Anonymous case evidence.

04The Series

Six problems. One year. One path from blind spot to decision.

One event every eight weeks. The sequence moves from permit pressure to public safety to capital strategy.

The Small-Cell Flood

Event 01 · Permitting

The Small-Cell Flood

How do you say yes fast without saying yes blind?

The city problem“Four wireless providers file 180 small-cell applications in one quarter. Federal shot clocks are running. Staff are reviewing pole heights and setbacks one PDF at a time.”
  • Standing up a map-based review queue
  • Screening sites against poles, lights, historic districts and sightlines
  • Design standards that hold up under deadline pressure
  • What a defensible denial — or approval — needs on the record
Who leans in ·
Permitting, ROW Managers, Planning, City Attorneys, Public Works
IQGeo role ·
Site and asset layers that turn an application queue into a map
The Coverage Map That's Wrong

Event 02 · Broadband Equity

The Coverage Map That's Wrong

Who actually isn't served — and how do you prove it?

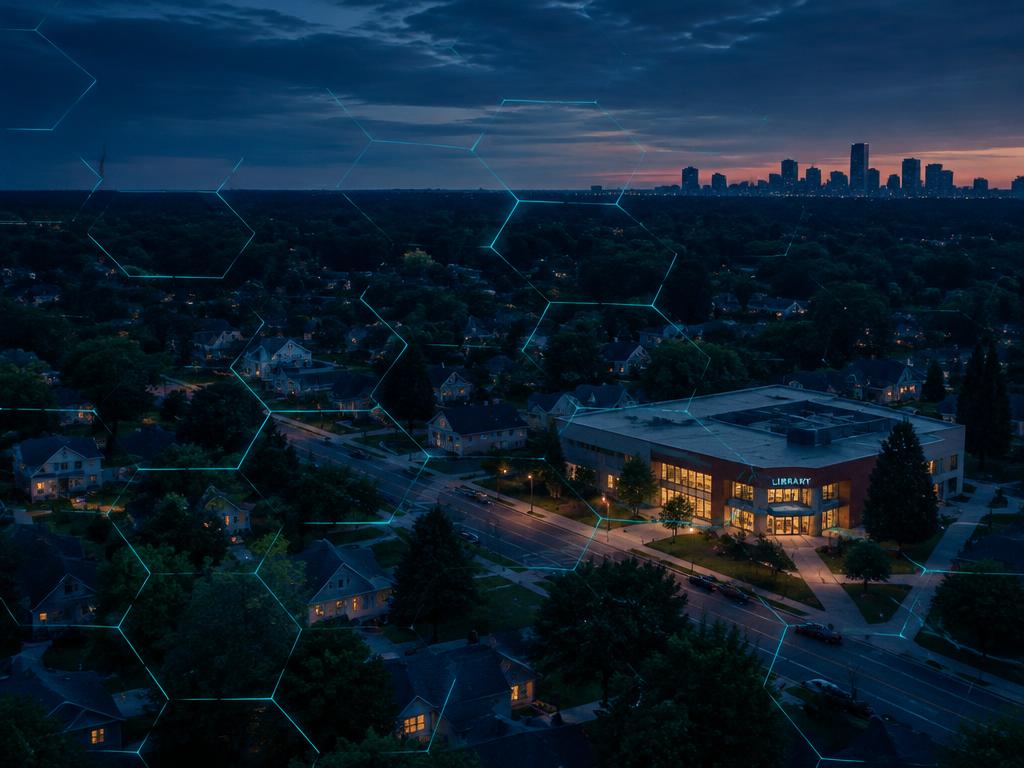
The city problem“The official map says the east side has broadband. Residents, schools and the library say otherwise. A funding window opens in 60 days.”
  • Where provider-reported coverage and lived experience diverge
  • Building address-level evidence: speed tests, surveys, field checks
  • Prioritizing blocks by need, not by who complained loudest
  • Presenting uncertainty honestly to funders and council
Who leans in ·
Broadband/Digital Equity Leads, GIS, Economic Development, City Managers, Grants
IQGeo role ·
Combining coverage, demographic and address data into a defensible gap analysis
Dig Once, or Dig Forever

Event 03 · Right-of-Way

Dig Once, or Dig Forever

Can the city coordinate builds instead of absorbing them?

The city problem“Two fiber providers and the water department all plan to open the same corridor within 18 months. The street was repaved last year.”
  • Dig Once and joint-trench policy that actually gets used
  • Sharing planned-work data across departments and providers
  • Corridor-level conflict screening before permits are issued
  • Pavement degradation fees and cost recovery
Who leans in ·
ROW Managers, City Engineers, Public Works, Utility Coordinators, Broadband Leads
IQGeo role ·
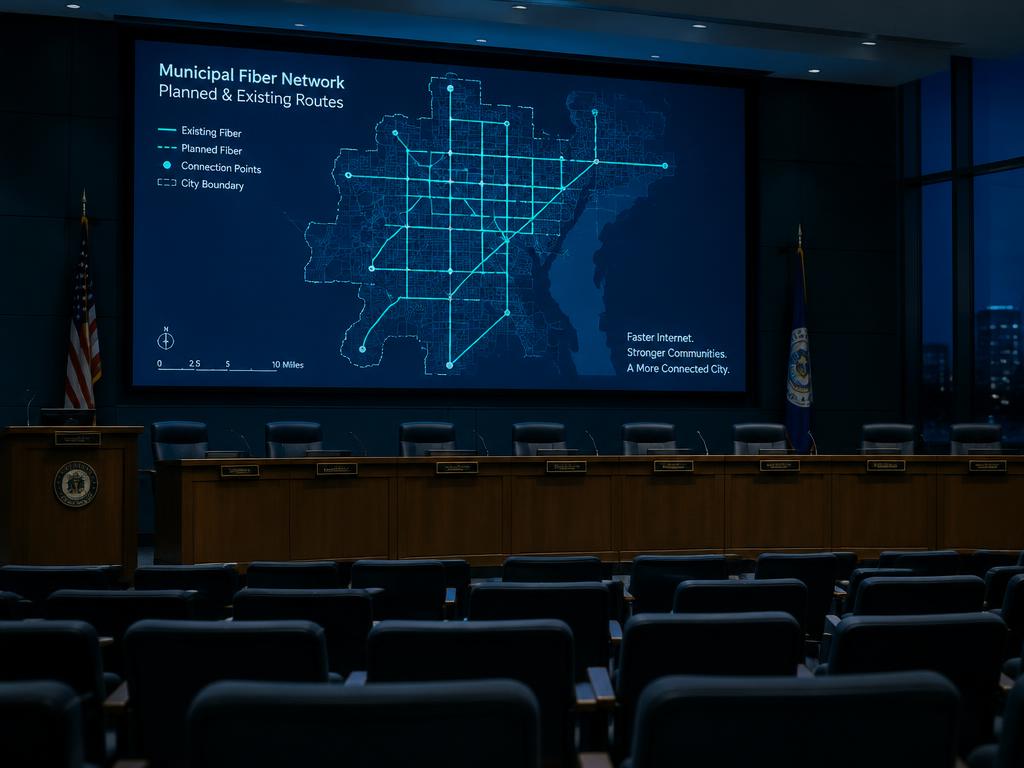
A shared corridor picture of planned and existing infrastructure
The Conduit Nobody Mapped

Event 04 · Asset Intelligence

The Conduit Nobody Mapped

What does the city own underground — and what is it worth?

The city problem“The city laid spare conduit during road projects for twenty years. A provider wants to lease it. Nobody can say where it runs, how full it is, or what to charge.”
  • Inventorying municipal fiber, conduit, poles and vertical assets
  • Turning scattered as-builts into a usable network layer
  • Lease, pole-attachment and revenue models grounded in real inventory
  • Keeping the inventory current after every project
Who leans in ·
IT/CIO, GIS Managers, Public Works, Finance, City Attorneys
IQGeo role ·
Data integration and processing that converts records into a maintained asset layer
The 911 Call That Went to the Wrong Place

Event 05 · Public Safety

The 911 Call That Went to the Wrong Place

When location data fails, who finds out first?

The city problem“A caller in a new subdivision reaches 911. The address isn't in the system, the call routes to the neighboring jurisdiction, and the ambulance loses four minutes.”
  • Why Next Generation 911 runs on GIS data quality
  • Address points, road centerlines and boundaries as life-safety assets
  • Mapping cellular dead zones that matter to responders
  • Who owns the data, the updates and the accountability
Who leans in ·
Emergency Communications/911 Directors, GIS, Fire, Police, Emergency Management, IT
IQGeo role ·
Validation, analysis and visualization of the location data responders depend on
Where the Next Dollar Goes

Event 06 · Capital Strategy

Where the Next Dollar Goes

How do you invest in connectivity with evidence, not instinct?

The city problem“Council has set aside capital for connectivity — municipal fiber, public Wi-Fi, a partnership, or nothing yet. Every option has an advocate. None has a map.”
  • Scenario-based capital planning for connectivity
  • Weighing coverage, cost, demand and equity in one view
  • Partnership models: what the city brings, what it should ask for
  • Measuring return after the build
Who leans in ·
City/County Managers, Finance, CIO/IT, Economic Development, Council Staff
IQGeo role ·
Location-based investment scenarios and ROI modeling
1Permitting2Equity3Right-of-Way4Assets5Public Safety6Capital

Moderator

Jane Doe, GISP

Founder, GIS Management Academy · URISA Past-President · AGS Ethical GEO Fellow

Recurring SME

Mike Murphy

Title TBC

Practitioners

By problem

City CIO or Broadband Lead (TBC) · ROW / Permitting Manager (TBC) · 911 / GIS Data Manager (TBC)

IQGeo

IQGeo Specialist

One per event

We recruit expertise around the problem, not logos around a webinar.

05The Signature Poll

“How well does your city know what's running through its right-of-way?”

Asked live at every event. Tracked across all six. By year-end it becomes the first recurring measure of how much local governments actually know about the networks in their streets — and a standing data point IQGeo owns.

Very well — mapped, current and shared8%
Fairly well — good records, known gaps24%
Partially — records exist, but we don't trust them34%
Poorly — we learn from the permit applications21%
We don't know what we don't know13%

Illustrative fill.

Connected City Index (Illustrative)

41/100

A 0–100 score: the weighted average of responses, where 100 means every respondent answers “very well.” Populated live through the series.

by populationby departmentby asset typeby how data is maintained

Asset Mapping Insights · Year-End Report

The State of Connectivity Intelligence in Local Government

A year-end, evidence-led report built from six events of Signature Poll data, cross-tabbed by city size and department, alongside independent research and practitioner interviews. Presented by IQGeo. Independent in method.

  • Connected City Index trend across six events
  • Where cities first discover network data gaps
  • How right-of-way and telecom assets are tracked today
  • What separates confident agencies from the rest
  • Practical recommendations by city size
06Audience

Built for the people who permit, host and depend on the network.

120,000+
U.S. local-government contacts
~300
target registrations per session
~150
target live attendees
20–30
additional on-demand viewers
8 wks
of promotion per session

Targets based on typical AssetMapping.Events programs; not guaranteed.

Who should attend

  • City/County Managers & Council Staff
  • CIOs, IT & Broadband/Digital Equity Leads
  • GIS Managers & Analysts
  • ROW, Permitting & Planning
  • Public Works & City Engineers
  • 911, Emergency Management, Fire & Police
  • Finance, Grants & Economic Development

Database mix

  • 37%Public Works, Transportation, Planning & Facilities
  • 31%Leadership, Finance & Economic Development
  • 12%Fire & Law Enforcement
  • 7%GIS & IT
  • 14%Other

Built for the people who sign the permits and answer the 911 calls — not just the people who draw the lines.

07What IQGeo Gets

Presence, leads and content that lasts.

Visibility

  • “Presented by IQGeo” on all series branding, pages and registration
  • IQGeo logo and positioning on all emails and LinkedIn campaigns
  • Recognition at open and close of each session
  • A IQGeo specialist in all six sessions

Leads & Insight

  • Full opt-in registrant list per session (name, title, organization, jurisdiction)
  • Signature Poll plus live polls co-designed with IQGeo
  • Attendance and engagement reporting
  • Full Q&A transcript

Content That Keeps Working

  • Six Post-Event Intelligence Reports
  • The year-end State of Connectivity Intelligence report
  • Branded recordings on AssetMapping.Events
  • Rights to use reports and recordings in IQGeo sales and marketing
  • A series hub that stays live and indexed
08Intelligence Report

Every session becomes a lasting Intelligence Report.

Webinars end. Intelligence reports keep working. After each event, the Asset Mapping Insights team publishes the full archived webinar video alongside an evidence-led written report: the scenario, the expert positions, the decision path, the audience data, every question answered and a practical field guide. Each report includes its corresponding event recording for on-demand viewing. Independent in tone, credible to buyers, and something IQGeo can send to any agency.

Asset Mapping Insights · Post-Event Intelligence Report

The Small-Cell Flood

Webinar · [Date TBD] · Event 1 of 6

Open the Sample Report
Format in production: AI-Powered Utility Data in Practice — June 2026 →

What's inside each report

  1. 01Archived Webinar Video
  2. 02Overview
  3. 03Key Takeaways
  4. 04The Scenario & The Complication
  5. 05Expert Positions
  6. 06The Decision Path
  7. 07Evidence From the Field
  8. 08Field Guide
  9. 09Audience Polls & Signature Poll
  10. 10Full Q&A
  11. 11Glossary, Speakers, Resources
Open the Sample Report
09Timeline

From commitment to year-end report.

Dates TBD — proposed series start [Month] 2027.

  1. Week 0

    Commit

    Agreement, kickoff, confirm IQGeo specialists

  2. Weeks 1–2

    Build

    Scenarios, speaker briefs, landing pages, Signature Poll design

  3. Week 2

    Launch

    Promotion opens 8 weeks ahead of Event 01

  4. Events 01–06

    Live

    Every 8 weeks, 11:00 AM–12:30 PM Mountain

  5. +10 business days per event

    Report

    Post-Event Intelligence Report published

  6. Series wrap

    Year-End Report

    State of Connectivity Intelligence published, plus consolidated audience and lead summary

10Investment

Presenting Sponsor — Full Series (6 Events)

Sponsorship fee

To be agreed

Inclusions

  • Presented-by branding across the series
  • A IQGeo specialist in all six events
  • Full opt-in registrant lists and engagement reporting
  • Co-designed polls plus the Signature Poll
  • Six Post-Event Intelligence Reports
  • Year-end State of Connectivity Intelligence report
  • Branded recordings and a permanent series hub
11Why ConnectMii Events

Programming built from the problem out.

Problem-led programming

We build from the operational problem out. Sponsors show up as practitioners, which is why audiences stay.

A local-government audience at scale

120,000+ contacts across public works, IT, GIS, public safety, finance and leadership.

Intelligence, not just webinars

Every session becomes an evidence-led report under the Asset Mapping Insights brand.

Real-world problems. Real intelligence. Real impact.